A reference for understanding what each setup type means, how to read the results, and how to use this app effectively as a research tool. Not financial advice.
Six of the tabs are distinct trading approaches, each with its own time horizon, market thesis, and ideal conditions. They're six different bets on six different market behaviors — not six versions of the same thing. (Two more tabs — Insider Clusters and Congress — are corroboration tools rather than standalone styles; they're covered just below.)
| Style | Hold | Bet | Best Market |
|---|---|---|---|
| Quick Swings | 3–10 days | "Uptrend continues after a brief dip" | Healthy bull market |
| Oversold Reversals | 1–4 weeks | "This selloff has gone too far, bounce coming" | Choppy / corrective market |
| Base Breakouts | 3–12 weeks | "This consolidation is about to expand into a major move" | Trending bull with leadership |
| VCP Patterns | 3–12 weeks | "Volatility is compressing, a directional move is loading" | Any trending environment |
| High Tight Flag | 2–8 weeks | "An explosive move is pausing briefly before continuing" | Strong momentum / leading stocks |
| Biotech Spike | Catalyst-dependent | "Silence before a binary catalyst precedes a sharp move" | Pre-catalyst biotech, any tape |
The remaining two tabs — Insider Clusters and Congress — are not trading styles. You don't enter a trade off them on their own. They tell you who else is buying, so you can strengthen or weaken your conviction in a setup you found through one of the six styles above.
| Tool | What it is | What it tells you | How to use it |
|---|---|---|---|
| Insider Clusters | Multiple company insiders buying the same stock in a short window | The people closest to the business are putting their own money in | Confirmation layer on a chart setup — not a signal to buy on its own |
| Congress | Disclosed stock transactions by members of the House and Senate | What politicians (and their disclosed filings) are trading, with win-rate context | Context and idea-sourcing — corroboration, never a standalone entry trigger |
Treat both the same way: a setup with insider or congressional buying behind it has more going for it than one without — but the chart, the stop, and your risk still decide the trade. These tools raise or lower conviction; they do not make the decision.
Every flagged setup has a confluence score. The score reflects how many supporting signals fired alongside the primary pattern. Higher is better. Score scales vary by setup type — swings and oversold use 0–6, base breakouts use 0–7, VCPs use 0–10.
VCP (Volatility Contraction Pattern) is the primary lens of this app. Coined by Mark Minervini, it identifies stocks forming successively shallower pullbacks against a horizontal resistance line — the signature of supply being absorbed before a directional breakout.
Beyond the standard columns (Ticker, Score, Price, Stop, R:R), the VCP tab adds several pattern-specific columns that take some learning to read fluently.
| REVERSAL | Base formed after a downtrend. The "post-bottom" variant. Highest reward potential when combined with S4→S1 stage transition. |
| CLASSICAL | Base formed during an uptrend (above the 200-day MA). The Minervini textbook setup. High base-rate success when combined with S1 or S2. |
| SIDEWAYS | Neither clear uptrend nor downtrend pre-base. Lower-conviction; treat as a structure that may or may not resolve directionally. |
When the ⚓ icon appears next to Mode, the detector used reversal-anchor logic to identify a sub-base above a recent significant low. The pivot is anchored to the post-recovery high, not to older pre-decline peaks. This catches VCPs forming above a major reversal point where the relevant resistance is the local high, not the all-time top.
Anchor used is additive, not a quality flag — same strict rules applied, just at a different anchor point. Common in biotech and post-correction names.
Clicking a VCP row opens the detail panel showing every contraction in the sequence — start date, depth percent, duration, volume ratio. You can verify visually whether the contractions tighten cleanly, whether volume dries up at the final compression, and whether the base structure looks like what you'd accept on a chart. The detail panel is the primary tool for separating "looks tight" from "actually is tight."
Imminence estimates the probability that a setup breaks out within ~30 trading days. Imminence is derived from features that actually correlate with fast breakouts in the historical data, and it is shown as an honest percentage.
Critical: Imminence predicts timing, not winning. In the data, fast breakouts do win more (69% vs 49%), BUT the imminence signals only raise the chance of a fast move — win rate stays roughly flat (~50–55%) across all imminence levels, because most signaled setups still don't break fast. So use Imminence to judge when a setup might move, never whether it will win. Grade is your "whether"; Imminence is your "when." Prioritize among high-grade setups by imminence — don't chase a high imminence at the expense of a low grade.
Five independent signals each add to the estimate: shallow first contraction, high depth-ratio (contractions that don't over-narrow), price near/past pivot, few contractions (≤3), and non-reversal mode. The more that fire, the higher the odds of a near-term breakout:
Why the numbers look modest: that's the honest truth about breakout timing. Even every signal aligning only gets you to ~40%. A tool that showed "IMMINENT!" would be overpromising; the percentage tells you the real base rate. Use it to sort when, lean on Grade for whether.
Stan Weinstein's 4-stage market cycle is the macro context layer for every VCP. The Stage column tells you where in the cycle the stock is, which is at least as important as the technical pattern itself. Transitions matter as much as the stages.
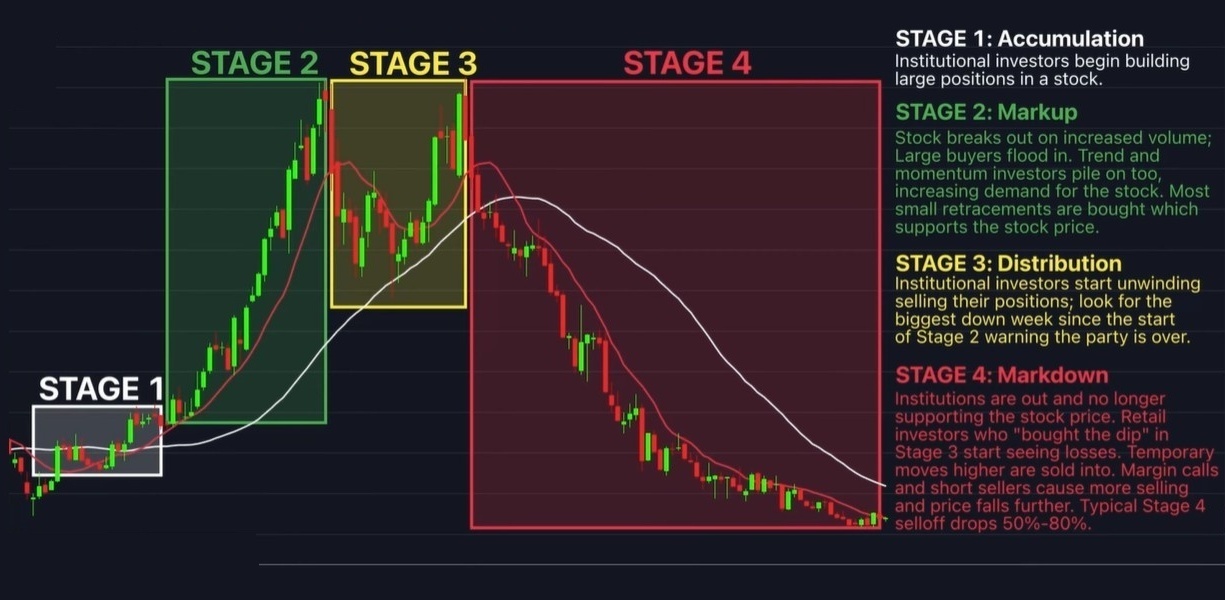
| Stage 1 — Basing | Sideways consolidation after a downtrend. 30-week MA flattens. Smart money accumulates before the trend resumes. |
| Stage 2 — Markup | Sustained uptrend above a rising 30-week MA. Where most price appreciation happens. |
| Stage 3 — Topping | Uptrend stalls. Sideways with growing volatility. 30-week MA flattens. Smart money distributes into retail buying. |
| Stage 4 — Markdown | Sustained downtrend below a falling 30-week MA. Where you want to NOT be holding. |
Stage is context, not a filter. The scanner doesn't reject patterns based on stage — it surfaces them and tells you the cycle context. Your position sizing, stop discipline, and profit-taking should adjust accordingly. A high-Imminence setup in S4→S1 is a different animal than the same reading more urgent in S2→S3, even though the Imminence estimate is identical.
The Sector column and the sector strip (at the top of the VCP tab) provide macro tailwind/headwind context. Leadership comes in groups — a high-Imminence setup in a hot sector outperforms the same reading in a cold sector on average.
Eleven GICS sector ETFs displayed hot-to-cold by 30-day return. Green = top 3, gray = middle, red = bottom 4. At a glance you see which sectors are leading and which are lagging.
| TECH | Information Technology (XLK) |
| HC | Health Care (XLV) |
| FIN | Financials (XLF) |
| NRG | Energy (XLE) |
| IND | Industrials (XLI) |
| STPL | Consumer Staples (XLP) |
| DISC | Consumer Discretionary (XLY) |
| MAT | Materials (XLB) |
| UTIL | Utilities (XLU) |
| RE | Real Estate (XLRE) |
| COMM | Communication Services (XLC) |
Rotation read: compare Top 5 (30d) vs (60d). Sectors in 30d but not 60d are newly hot (rotation in) — VCPs there have the most tailwind. Sectors in 60d but not 30d are losing momentum (rotation out).
The Insider column cross-references each VCP setup with cluster insider buying signals from your Insider Screener v2 results. The academic foundation: Cohen-Malloy-Pomorski (Journal of Finance 2012) showed that opportunistic insider purchases (non-routine, clustered) generate roughly 82 bps/month of risk-adjusted excess return — the most evidence-backed alpha source in the framework.
The cross-reference reads from the Insider Screener v2 JSON output. If the insider column is dash across all tickers, check that the screener has run recently and the results file is accessible at the configured path.
The ★ / ☆ star column lets you promote any setup to your Watchlist tab. This is especially valuable for CANDIDATEs — VCP near-misses that your eye agrees are tradeable even though they failed one or more strict rules.
Why promote CANDIDATEs instead of loosening thresholds globally? Because strict thresholds protect the textbook VCP detection from being polluted by marginal cases. The promote mechanism gives you per-ticker discretion without sacrificing the rigor of the strict detector. Your judgment is the filter, not the parameter.
Click the ticker in any setup table to open its TradingView chart in a new tab — separate from the row's detail-panel click. Use this for fast chart verification before deciding to promote.
The Lookup tab lets you analyze any ticker on demand, even if it's not in the daily scan universe. Type a symbol, click Analyze, and the app runs all scanners against it with thresholds disabled — so you see every factor that fires, not just the ones that meet the qualifying score.
Each scanner returns one of three verdicts:
The lookup also shows a full indicator snapshot (RSI, MACD, MAs, ATR, volume) and any candlestick patterns detected in the last 10 sessions, regardless of whether they're part of a qualifying setup. Use this tab when you're researching a specific ticker rather than reviewing the daily flagged list.
| Ticker | Stock symbol. Click to open TradingView chart in a new tab. Click anywhere else in the row for the detail panel. |
| Watch | ★ / ☆ promote toggle. Adds the ticker to the Watchlist tab. |
| Score | Confluence score (scale varies by setup type — 0–6 swings/oversold, 0–7 base, 0–10 VCP). |
| Price | Most recent close. |
| Stop | Hard exit price — cut the trade if hit. |
| R:R | Reward-to-risk ratio at first target. Higher is better. |
| Tier | ✓ VALID (strict rules) or ⚠ CANDIDATE (marginal rules). See VCP section above. |
| Imminence | Estimated % chance of a breakout within ~30 days. Timing only, not a win predictor. See the Imminence section above. |
| Stage | Weinstein stage (S1–S4) and transition status. See Stage section above. |
| Insider | Insider cluster status from Insider Screener v2. See Insider section above. |
| Sector | GICS sector abbreviation + 30-day rank (1 = hottest). Green/gray/red coding. |
| Mode | REVERSAL / CLASSICAL / SIDEWAYS. ⚓ icon means reversal-anchor logic was used. |
| Pulls | Number of contractions detected in the base. 3–6 is textbook. |
| Pivot | Resistance line of the base. A close above on volume confirms the breakout. |
| % to Pivot | Current price vs pivot. Negative = below pivot (setup forming). Positive = breakout in progress. |
| Final | Depth of the final contraction. Tighter is better; under 5% is ideal. |
| Weeks | Total base duration in weeks. |
| Pattern | Candlestick pattern detected (swings, oversold). |
| RSI | Relative Strength Index at signal. < 30 oversold, > 70 overbought. |
| Age | Days since pattern fired. Fresher = better. |
| Off High | Percent below 52-week high (oversold only). |
| Base Type | Flat Base, Cup, etc. (base breakouts only). |
| Length / Depth | How long the base has been forming, how deep the pullback (base breakouts). |
| Status | Building, At pivot, Breaking out, Breaking out (low volume), Extended. |
| Entry / Target | Suggested buy zone (low–high range) and first profit target. |
Sortable headers: click any column header to sort by that column. Click again to reverse direction. Sort preference is per-tab and persists across reloads.
The framework's layered design means high-conviction setups are identifiable by combining filters and signals. Here's the workflow for surfacing the rare 4-aligned candidates from a typical scan.
- Set sector filter to Top 5 (30d). Narrows to leadership groups. The macro tailwind layer.
- Set tier filter to Valid only. Removes CANDIDATE noise. Strict-quality patterns only.
- Sort by Imminence descending. Click the Imminence column header. The most imminent breakouts surface at the top.
- Scan the Stage column. The top of the sorted list is your candidate pool. Look for S4→S1 (highest reward-to-risk) and S1 or S2 (high conviction). Treat S2→S3 with caution per the stage section above. Skip S3 outright unless you have an independent reason.
- Check the Insider column. STRONG or WATCH cluster status adds an independent confirmation layer.
- Click the ticker to verify the chart on TradingView. Trust your eye over the scanner. If the chart looks extended, post-catalyst, or in a downtrend the stage classifier missed, skip it.
- Star ★ the survivors. Build your watchlist from eye-verified high-conviction candidates.
The rare setup that survives every layer — hot sector + VALID tier + High Imminence + S4→S1 or S1 stage + STRONG insider + clean chart — is the home-run candidate. These are uncommon (often zero or one per scan). When they appear, they're worth your largest position size.
The Biotech Spike tab fuses three independent data sources for each biotech setup, shown as three side-by-side columns so you read each signal on its own rather than trusting a single blended score:
The skeptic has a voice, not a veto. A technically strong setup that App #9 flags as Scenario C or D is shown with a red TRAP WARNING and sunk to the bottom — never hidden. The highest-conviction setups are the rare ones where all three agree: coiled chart, catalyst near, and a clean verdict. Missing signals are labeled explicitly so silence is never mistaken for safety.
Coverage note: the three sources scan different universes, so many rows show a strong Setup column but "no calendar date" / "not verified" in the others. That's the real state of the data, not a malfunction — the three-column design stays useful with partial overlap.
Inside any VCP setup's detail panel, the Options Overlay offers a defined-risk, lower-cost way to play the breakout instead of buying 100 shares. It leads with two bullish structures you toggle between: Single Calls and Bull Call Spreads (debit spreads) — with the spread as the lower-cost, capped-risk default. Everything is computed from the live option chain and fitted to the setup's own projected target.
Fitted to your target. Each structure is built around the setup's Aegus projected target (target_1), shown as a green line at the top of the overlay. For bull call spreads, the short strike is placed relative to that target, and the overlay presents a small desk-style menu by move-capture: Full-target (short strike at the target — captures the whole projected move, highest ceiling, priciest), Balanced (~60–85% of the move, most of it for less cost), and Value (~35–60% of the move — cheapest defined-risk entry). You size contracts to your budget; the structure expresses the view.
Single calls are the simpler, more leveraged play (one leg, no cap on the upside) — but they carry the full premium at risk and bleed value as the stock sits still (theta), so the overlay flags them as the higher-risk choice and points you to the capped-loss spread. Each call pick shows a conservative projected floor drawn from the setup's own historical behavior.
For biotech catalyst setups: when the setup carries a catalyst date, apply the PDUFA run-up discipline — enter 6–8 weeks out, exit 1–2 weeks before the decision to avoid the IV crush, and size smaller because binary events don't respect normal risk rules.
Honest limits, shown under every result: probability-of-profit and any EV figures assume a lognormal model, so real-world tail losses are larger and more frequent than displayed. Numbers are computed at realistic fills, not mid-price. Defined-risk structures are the default; a single call's max loss is its full premium. This is a research overlay on current data — not a recommendation. Decide your exit before you enter.
- Aegus Proprietary Research · 31,000-Breakout VCP Study (8 years) — our own detailed analysis of over 31,000 VCP breakouts across eight years, studied for profit-related anomalies and strategically utilized in our custom filter and ranking engines. This empirical work refines the published methodologies below where our data and the classic rules disagree.
- Mark Minervini · Trade Like a Stock Market Wizard — volatility contraction pattern, base quality, the primary VCP methodology this app implements
- William O'Neil · How to Make Money in Stocks — base structures, CANSLIM, pocket pivot
- Stan Weinstein · Secrets for Profiting in Bull and Bear Markets — 4-stage cycle analysis, the foundation of the Stage column
- Steve Nison · Japanese Candlestick Charting Techniques — candlestick pattern definitions for Swing / Oversold detection
- Thomas Bulkowski · Encyclopedia of Candlestick Charts — statistical performance of candlestick patterns
- Cohen, Malloy & Pomorski · Decoding Inside Information (Journal of Finance, 2012) — opportunistic vs routine insider classification, ~82 bps/month documented effect, the academic foundation of the insider cluster cross-reference